Low-Latency Solana RPC: How to Benchmark Real Performance Before Choosing a Provider
Learn how to benchmark low-latency Solana RPC performance using real workload regions, method mix, concurrency, freshness, stream behavior, and transaction confirmation data.
Provider pages often show region counts, uptime badges, and latency numbers without enough context about where and how those numbers were measured. In real Solana workloads, lower median RPC response time does not always improve user-facing performance.
Benchmarking has to match the workload: region, method mix, concurrency, freshness, and the full path from submission to confirmation. The broader Solana RPC infrastructure layer includes endpoint topology, read/write separation, routing, streaming, and indexing. Here, the focus is narrower: measuring latency against a real workload.
Low-latency Solana RPC is not one metric
What gets called "Solana RPC latency" is, in practice, at least four separate clocks running in parallel — and optimizing one of them while the others stay fixed can leave the workload behaving exactly as it did before.
Read latency is what most provider benchmarks measure — how quickly the node responds to calls like getAccountInfo, getBalance, or getLatestBlockhash.
Stream freshness is how quickly a WebSocket or gRPC feed reflects what the network just did. A node can answer HTTP calls quickly while sitting several slots behind the tip. For event-driven logic, that gap is the limiting factor.
Submission latency is how quickly a signed transaction reaches a useful ingress path after sendTransaction is called. The RPC accepting the request and the transaction reaching a leader are separate events.
Landing and confirmation latency depends on fee levels, routing, congestion, and the leader schedule. A fast HTTP response does not affect any of those.
Solana's API model reflects these distinctions by design — sendTransaction returns before confirmation happens, different commitment levels express different degrees of certainty about what has settled, and subscriptions exist because polling has costs that compound at scale. Method behavior, commitment levels, subscriptions, and endpoint patterns sit in the Solana API and RPC endpoint layer.
What to benchmark from the production VPS
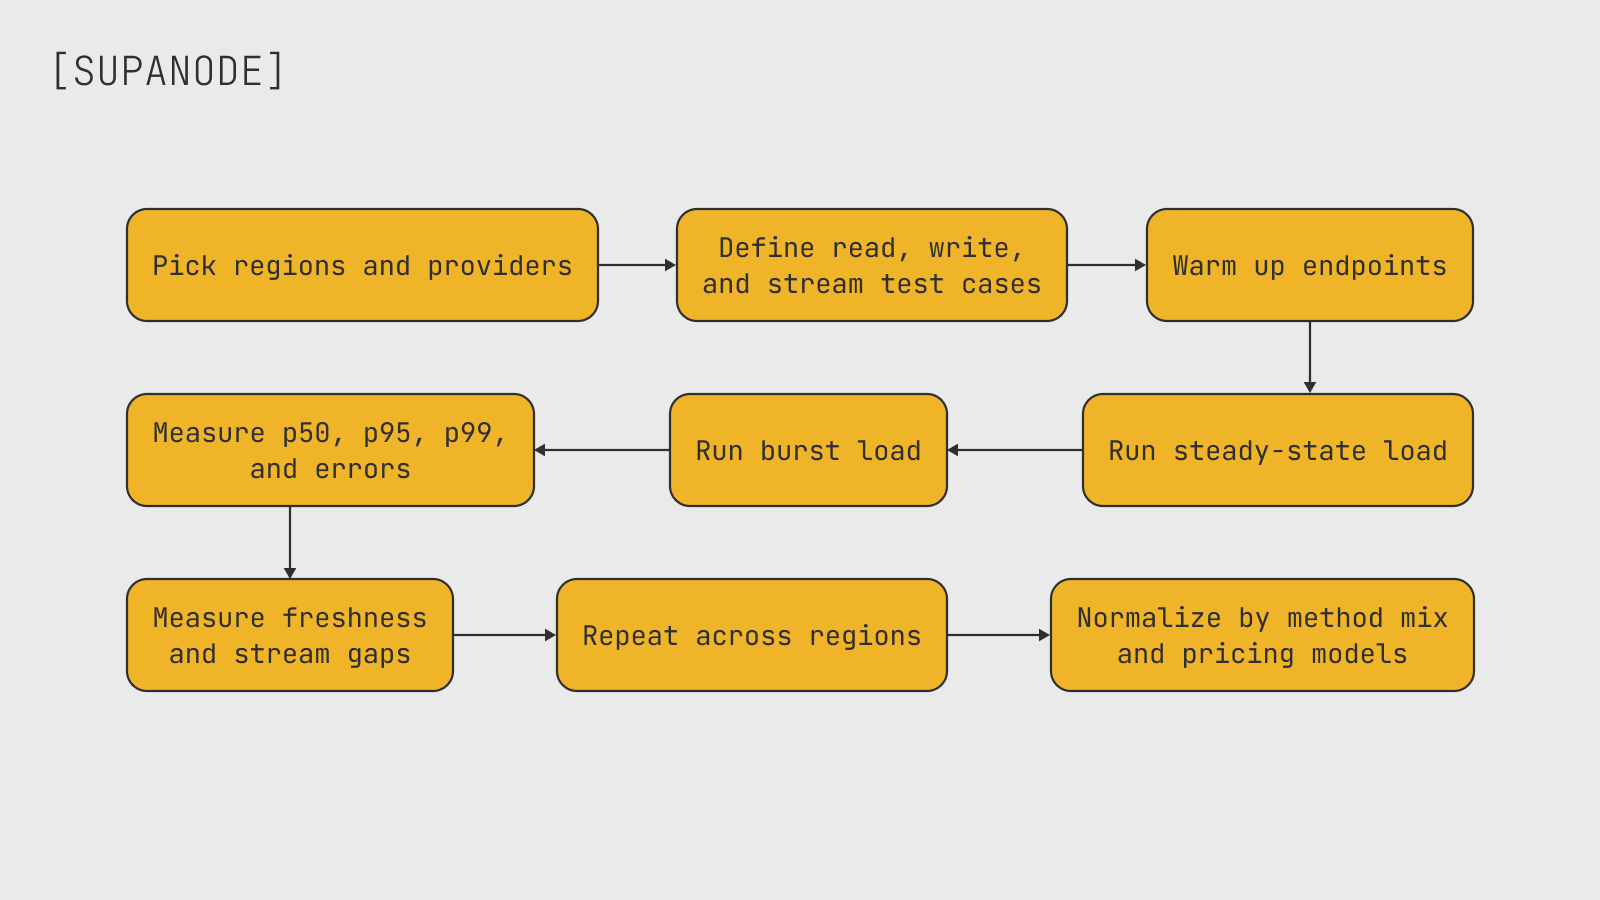
A credible benchmark samples real methods, from the real workload region, at realistic concurrency, and collects percentile distributions — not one-off measurements or averages. Here is the minimum scope:
Read path
- Response time percentiles — p50, p95, and p99 — for the methods the app actually calls, including heavier ones like
getTransactionor filteredgetProgramAccounts, not just lightweight reads - HTTP error rate, timeout rate, and 429 frequency at realistic concurrency
- How the endpoint behaves when the rate limit is hit: hard stop, graceful backoff, or silent failure
- How tail latency shifts under burst traffic compared to baseline
Node freshness
getSlot, getHealth, getMaxShredInsertSlot, and getMaxRetransmitSlot together give a usable freshness heuristic. A node can answer requests quickly while serving state that is several slots behind. For time-sensitive workloads, that difference matters more than raw HTTP response time.
Stream path
- Notification delay for slot, logs, or account subscriptions — measured against a reference feed where possible
- WebSocket reconnect frequency, particularly during high-activity windows when subscriptions are most likely to drop
- For gRPC feeds: first-seen delay relative to the same reference
Submission and landing
- Time from
sendTransactionto accepted response — this is submission latency, and it confirms the RPC received the request, nothing more - Time from that same call to
processed, thenconfirmed, thenfinalized— each commitment level is a separate measurement worth tracking independently - Blockhash expiry rate under retry conditions, which surfaces quickly on congested networks
sendTransaction returning a successful response means the RPC accepted the request — nothing more. Treating acceptance as landing produces silent confirmation failures that are difficult to diagnose later.
Baseline versus burst
Run the same test suite at low concurrency and at peak expected load. Shared endpoints that look clean during quiet windows can behave differently when another customer's traffic spike triggers rate limiting.
A common benchmarking mistake is testing a few hundred requests during a quiet window and treating the result as production validation. Solana's behavior under congestion and during low-traffic periods are different enough that quiet-window tests can produce numbers that do not reflect real workload conditions.
Why RPC region and VPS location matter
RTT between two points depends on distance, hop count, routing quality, and congestion. Most production Solana apps don't make one isolated call — they chain reads: check state, evaluate, build transaction, submit, track confirmation. Every call in that loop adds distance cost.
If the backend is in Frankfurt and the provider's closest node is optimized for a different region, no latency claim on a landing page changes the network path. We've seen teams benchmark from a local laptop, get sub-30ms numbers, and discover production latency from the VPS is three or four times that. The benchmark had measured the wrong path.
The benchmark that matters is Frankfurt-to-Frankfurt, Ashburn-to-Ashburn, Singapore-to-Singapore — from the machine that runs the workload, not from a developer's home connection or a provider dashboard that smooths over geography.
The real latency path in a Solana application
End-to-end latency includes more than the RPC endpoint.
On a write path: user action → frontend → backend → RPC (state reads, transaction build) → submission path → validator/leader → cluster processing → confirmation tracking → UI update.
On a stream-driven path, a parallel track runs: network event → provider feed → backend consumer → frontend state update.
Improving one segment while the others stay fixed just moves the bottleneck. Cutting HTTP read latency while leaving confirmation tracking slow produces a workload that still behaves the same way from the user's perspective. Solana's commitment model matters here too — waiting for finalized when confirmed is operationally sufficient adds avoidable delay that has nothing to do with the endpoint.
Backend-to-RPC latency vs user-to-RPC latency
For server-side apps — trading systems, payment backends, indexers, automation workflows — the relevant path is backend/VPS to RPC. What matters is how efficiently the backend reads state, executes logic, and submits from its own region.
For wallet frontends or dashboards that connect directly to an RPC endpoint, user-to-RPC latency matters too. But direct frontend connections carry a tradeoff: if a private or dedicated endpoint is exposed client-side to reduce latency, its credentials are visible to anyone reading browser network traffic. Rate-limit abuse, credential scraping, and endpoint overload follow. Endpoint exposure belongs in the Solana RPC endpoint security layer, not in the latency benchmark itself.
Backend-heavy apps should benchmark and optimize the backend-to-RPC leg. Frontend-direct architectures should assess what happens once the endpoint is exposed — and whether a backend proxy, which adds one small hop, is worth the protection it provides.
Why ping is not enough for Solana RPC benchmarking
Ping tells you the ICMP round-trip time to an IP address — which is roughly useful for confirming that Frankfurt is closer than Singapore, or that packet loss is unusually high on a given path. What it doesn't tell you is anything about how the RPC layer actually behaves under real conditions: how long getTransaction takes under load, what p99 looks like on getProgramAccounts, whether logsSubscribe holds stable during high activity, how the endpoint responds when 429s start appearing, or how long a submitted transaction takes to become confirmed.
Averages have a related problem. A provider with a 40ms average and an 800ms p99 is a different infrastructure story from one with a 60ms average and a 95ms p99. The tail events — congestion windows, leader transitions, burst traffic on shared endpoints — are the moments that matter most in production, and averages smooth over all of them.
Shared RPC vs dedicated RPC for latency-sensitive workloads
Solana's public endpoints are explicitly rate-limited and not built for production. The real question starts one step later: when does dedicated infrastructure justify the added cost over a shared commercial plan?
Shared plans pool requests with other customers on the same node infrastructure. For many apps that's fine. The question is what happens at the tail under contention. A benchmark during a quiet window may look clean, then behave differently in production when another customer's burst triggers rate limiting or degrades shared node response times.
A dedicated RPC node changes the isolation model. Traffic doesn't compete with other customers, regional placement is under direct control, and tail latency becomes more predictable. That's useful once the bottleneck is confirmed to be shared-endpoint contention — not as a first move before benchmarking.
What dedicated RPC does not automatically fix: stream freshness if the node's gRPC path isn't optimized, transaction landing if the submission path isn't staked or SWQoS-aware, or query shape problems involving wide account scans or deep history. Some dedicated node products are built primarily for streaming workloads and are explicit in their documentation that sendTransaction is supported but not optimized — meaning many transactions submitted through them may not land reliably. That's an architectural boundary, not a flaw. The question is "dedicated for which specific bottleneck" rather than "shared or dedicated" in the abstract.
Where gRPC, shreds, and WebSocket fit
For event-driven workloads, faster polling rarely addresses the real bottleneck. Solana's subscription API exists because polling has costs that compound at scale.
Standard WebSocket subscriptions cover most real-time needs: slots via slotSubscribe, matching transactions via logsSubscribe, account state changes via accountSubscribe, confirmation tracking via signatureSubscribe. For many apps currently polling via HTTP, switching to WebSocket subscriptions is the right first step — and often resolves the freshness problem without further infrastructure changes.
Where standard WebSocket runs into limits: blockSubscribe is explicitly marked unstable in Solana's documentation and isn't universally available. Standard subscriptions also depend on the RPC node having processed the data already — under congestion or on a node running slots behind, that adds delay.
Yellowstone gRPC and shred-derived feeds address this gap. They are different data paths operating at different points in the block lifecycle. Yellowstone/gRPC streams from the validator before the RPC layer fully processes the data. Shred-derived feeds go further — tapping into leaders as blocks are being assembled, ahead of processed confirmation. For backend ingestion, Yellowstone gRPC becomes relevant when WebSocket freshness is no longer enough.
In practice: WebSocket first, gRPC if WebSocket is not enough, shreds only when block-assembly timing matters. Adding shred infrastructure before confirming that freshness is the limiting factor adds complexity without addressing the failure point.
Why low RPC latency does not guarantee transaction landing
A fast RPC response does not mean the transaction landed.
When sendTransaction returns a successful response, it means the RPC accepted the request. Whether the transaction reaches a leader, gets scheduled, and becomes confirmed depends on factors outside the endpoint:
- Priority fees affect how likely the current leader is to schedule the transaction ahead of competing ones. Under congestion, an underpowered fee means the transaction waits, gets dropped, or expires. Priority fee calibration is a separate part of transaction landing, not an HTTP latency issue.
- SWQoS (Stake-Weighted Quality of Service) means leaders prioritize transactions arriving through staked validators. Not all shared endpoints participate in staked routing. Whether a given provider does — and how — affects landing quality under load in ways that median HTTP response time won't show.
- Blockhash validity is finite, roughly 150 slots. On a congested network with slow retries, the blockhash can expire before landing. The failure is silent unless the app explicitly tracks it.
- Submission path architecture varies between providers: unstaked routing, staked connections, dedicated sender products that route to both validators and bundles.
If transactions are missing, expiring frequently, or requiring many retries, the places to investigate are fee strategy, SWQoS-aware routing, and the submission path. At that point, the problem moves into fast transaction sending rather than ordinary RPC response time.
How to decide what infrastructure upgrade you actually need
High p95/p99 and 429s appearing under load
Check region alignment first. A backend-to-RPC distance mismatch explains much of this. If region is correct and contention is confirmed, test a dedicated or isolated endpoint and compare percentile distributions — not averages.
UI or backend logic feels stale despite reasonable HTTP read times
The bottleneck is stream freshness, not read latency. Start with WebSocket subscriptions. If that's insufficient, evaluate gRPC. For the earliest possible signal on block assembly, assess shred-derived feeds.
sendTransaction returns quickly but transactions land poorly or expire frequently
Review priority fee calibration, check whether the endpoint uses staked or SWQoS-aware routing, and assess whether a dedicated sender path suits the workload.
Confirmation tracking is slow or inconsistent, but landing itself is fine
Usually an app-side issue: polling interval, commitment level, or retry logic. signatureSubscribe is more efficient than polling getSignatureStatuses in a loop. confirmed is often the right commitment target rather than finalized.
Wide account scans or history queries timing out
getProgramAccounts with broad filters is expensive regardless of node speed. Pagination, tighter filters, or an indexed API will help. A faster endpoint won't.
Frontend-direct connection chosen for latency reasons
Reassess what gets exposed client-side before optimizing further. A backend proxy adds one small hop and removes meaningful endpoint security risk.
When low latency matters and when it does not
Latency matters when timing changes execution quality: trading bots, payment flows with customer-facing confirmation UI, wallets where stale state is noticeable, automated execution systems, and real-time feeds. For high-speed execution workloads specifically, the bar is tighter.
For back-office analytics, batched sync, or non-urgent reporting, reliability, cost, and query shape matter more than median latency. Spending on dedicated infrastructure for those workloads is usually the wrong infrastructure spend regardless of how the benchmark looks.
Practical checklist before choosing a low-latency Solana RPC provider
On benchmarking:
- Tested from the production VPS or cloud region — not a local machine
- Measuring p50, p95, and p99, not averages
- Testing the methods the app actually calls, at realistic concurrency including burst
- Testing across different network conditions, not only quiet windows
On provider transparency:
- Can the provider give region-specific p50/p95/p99 for standard Solana JSON-RPC methods?
- Are those percentiles for standard JSON-RPC, or only for a proprietary product layer?
- What is the behavior at the rate limit — hard stop, graceful backoff, or failover?
- What is the send path on paid plans: unstaked, staked, SWQoS-aware, or a dedicated sender product?
- Do they disclose slot lag or freshness metrics alongside HTTP response time?
On architecture fit:
- Which of the four latency clocks is actually the bottleneck for this workload?
- If moving to dedicated infrastructure, which specific bottleneck does it address — and what does it not address?
- If gRPC or shred feeds are needed, does the provider support and document that path clearly?
- Are there query patterns — wide scans, history fan-out — that need indexing rather than a faster endpoint?
Public apples-to-apples percentile disclosure for standard Solana JSON-RPC is still sparse across providers. Some publish provider-operated benchmarks for a single method. Some publish percentiles only for specialized product layers. Treating those numbers as a complete workload benchmark can lead to the wrong infrastructure choice — and an understandable one, because the gaps aren't always obvious from the outside.
Use measurements from your region, on your method mix, under your traffic pattern.
If your app depends on low-latency Solana RPC, benchmark from the VPS or cloud region where the workload actually runs. Supanode can help measure RPC latency, stream freshness, and transaction submission behavior for your specific setup — with a 48-hour free trial so teams can validate real workload performance before committing to any infrastructure change.